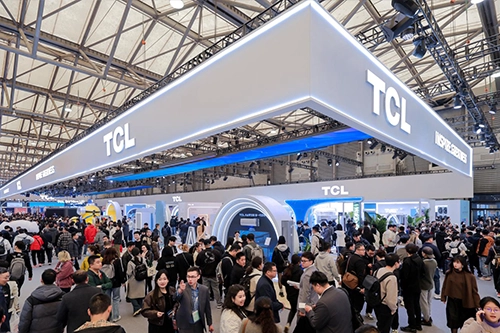
At recent display industry exhibitions, MIP and COB have emerged as key highlights for companies.
By 2027, monthly MIP shipments are expected to reach 10,000 KK (units). Meanwhile, COB technology is expanding its application areas by leveraging its technical strengths. A review of the first quarter reveals the following trends in COB development:
Growing International Attention: At the ISE exhibition, overseas markets showed increasing interest in COB, with clear export growth trends.
Panel Manufacturers’ Investment Plans: Major display panel manufacturers have announced concrete plans to invest in COB.
Focus on High-Value Applications: Some companies are prioritizing scenarios with higher output value per unit area, such as P1.2 and finer pixel pitch products. Large-scale COB projects are also rising, with the largest project (P1.2) covering over 500㎡.
1. 32% CAGR for COB Over the Next 5 Years
According to the 2025 LED Display COB Technology and Market Report (Special Edition), 2024 saw record-breaking COB output value and growth rates, with a year-on-year increase of 98%, surpassing ¥3 billion. The report predicts COB output value will approach ¥6 billion by 2025 and exceed ¥10 billion within three years. Over the next five years, COB is expected to grow at a compound annual growth rate (CAGR) of 32%. The number of COB manufacturers is also expanding, with panel makers actively investing in production capacity as observed in Q1 2024.
2. Declining Concentration of COB Production Capacity
The same report highlights that, in addition to the rising number of players, COB continues to show strong momentum in capacity expansion and penetration into finer pixel pitch markets. By 2025, planned monthly COB production capacity is projected to exceed 80,000㎡.
However, the primary contributors to this capacity will remain manufacturers that have championed COB technology over the past 2–3 years. As COB capacity grows, its distribution among manufacturers is becoming more decentralized, indicating a decline in production concentration. Over the next 2–3 years, new players are expected to enter the COB market with additional investments.
3. Surge in Large-Area COB Projects
The report notes that over the past five years, P1.2 has dominated COB shipments, with minor contributions from P0.9 and finer pitches. In 2023, P1.5 and larger pitches began entering the market. By 2024, P1.2 remains the mainstream product, accounting for 52% of shipments.
Currently, COB applications focus on small-pitch displays. However, recent projects reveal a rise in ultra-large-area COB implementations, exemplified by a single P1.2 project exceeding 500㎡. While COB is in a steady growth phase with clear long-term prospects, some manufacturers temporarily slowed investments in Q1 due to market fluctuations.
In 2024, COB accounted for 9% of the total LED display market value. This share is expected to surpass 10% by 2025, signaling COB’s emergence as a mainstream technology. Beyond the 10% threshold, P0.7 and P0.9 are anticipated to replace P1.2 in high-end markets, while P1.5 and larger pitches will drive incremental growth.

Competitive Landscape
Key players in the COB sector are advancing the technology through expanded production and R&D investments.
COB competition is expanding into finer (P0.9 and below) and coarser (P1.5 and above) pixel pitches to capture a broader market share. However, the rapid rise of MiP (Micro Integrated Packaging) technology may challenge COB’s push into premium markets. Meanwhile, SMD (Surface-Mounted Device) technology, with its established market presence and technical maturity, remains a formidable competitor.


